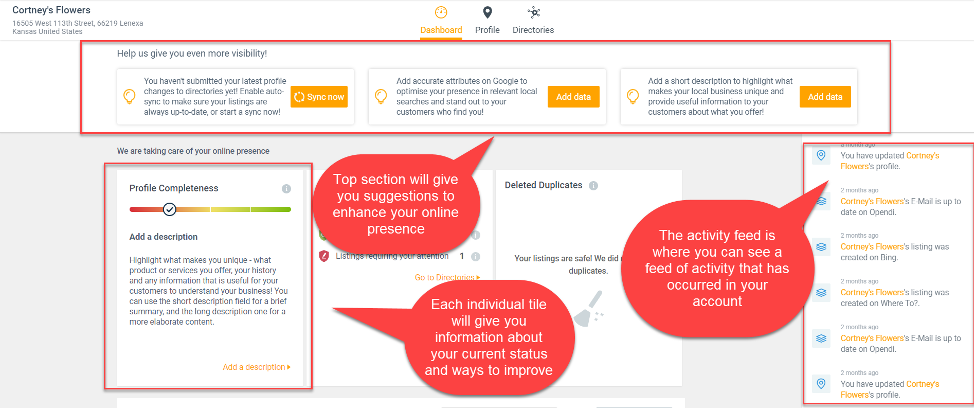
This is the main page you will see when you log in to your account.

The Dashboard has three main sections:
- A top section for suggested enhancements
- Middle section with various tiles providing information
- The right side is a feed of all activities occurring in the account

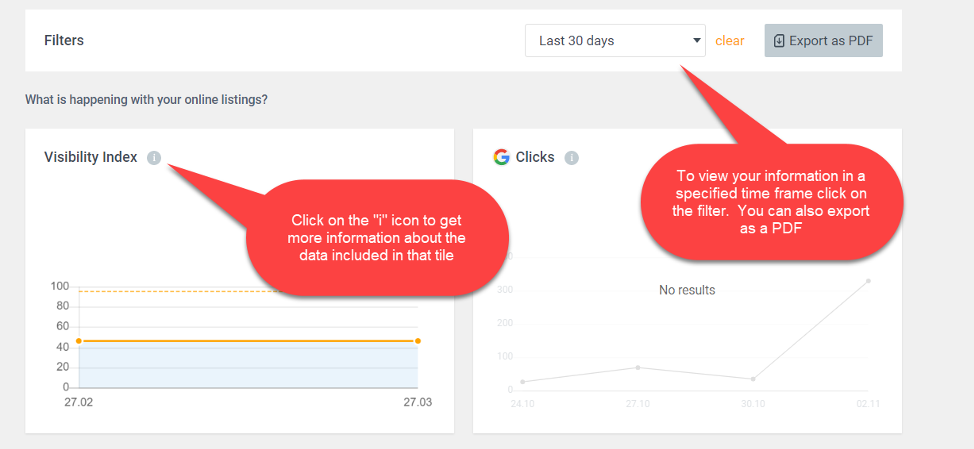
You can filter the information by a custom date. Just click on the dropdown. Once you see your results you have the option of exporting the information as a PDF file to share with others.

The following outlines the various types of information available to you in the tiles:
- Profile Completeness: Average percentage of most important filled out data points of
- all accounts/listings you manage.
- Visibility Index: An indicator of visibility. It compares the profile data with online directory data; the higher the number of fields completed in the profile, the more accurate the data is in the listings.
- Listings: Amount of listings and their sync status.
- Clicks: A click tells you how often your business profile was clicked on. Google and Facebook clicks can be seen up to 18 months in the past.
- Impressions: An impression tells you how often your location is shown. Google and Facebook impressions can be seen up to 18 months in the past.
- Photos: Number of times your photos have been seen by Google users.
- Queries: Number of times a customer has directly searched for your customers.